The Hamburg Weather Mast
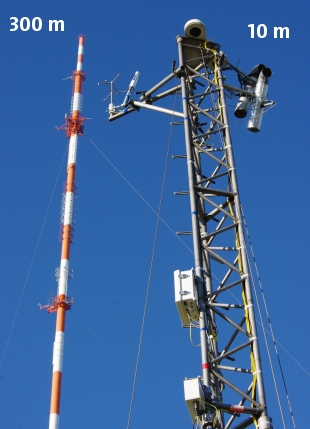
Since 1967 the Meteorological Institute at Universität Hamburg operates a scientific, meteorological measuring site in Billwerder, a suburb of Hamburg, Germany. It is located on an area of the NDR (the North German Broadcasting Company) and consists of devices at a 300 m tall broadcasting mast as well as at our own 10 m mast nearby on a meadow. Additionally, several ground-based devices are installed outside the operator's hut beneath the tall mast. In 1994 completely new equipment was installed, since 1995 measurement runs continuously until today.
Geographic position and surroundings
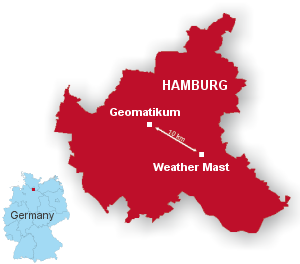
The Hamburg Weather Mast is located in Hamburg-Billwerder, about 8 km south-east of the city centre. (city map). The geographic coordinates of the tall mast are 53° 31' 09,0'' N and 10° 06' 10,3'' E, and 53° 31' 11,7'' N and 10° 06' 18,5'' O of the 10 m mast respectively. The site is located only 30 cm above German reference surface, so a device's height above ground is nearly identical to its height above mean sea level.
The surroundings of the area are characterised by a mixture of agricultural land, fallow ground, spoil areas, and sparsely populated hamlets in the East, and industrial sites with mostly low buildings in the West. So the site is located directly in the transition region between rural and urban kinds of landuse.
The meteorological equipment
The tall 300 m mast
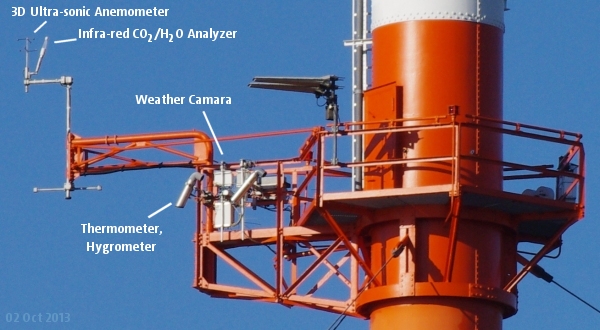
The tall mast has six walkable platforms in height levels 50, 70, 110, 175, 250, and 280 m that can be accessed by a lift inside the mast. On each platform there is attached a south-oriented cantilever arm that holds the instruments. The distance between mast and instruments is nearly 6 m, the diameter of the mast is 2 m. Each platform, except that at 70 m, is equipped with the same instruments: A ventilated thermometer (Pt100) for measuring the air temperature, a (relative) humidity sensor (Humicap) and a 3d-ultra-sonic anemometer (METEK USA-1) for wind speed and direction as well as turbulence quantities like sensible heat flux and momentum flux. At 50 up to 250 m there are fast CO2/H2O analyzers added to the anemometers for latent heat and carbon dioxide fluxes (see below). On the 70 m level there is a thermometer only (since September 2018 a combined temperature/humidity sensor HMP155). On the 110 m level a dew point sensor (VTP6) is installed as a reference device.
The 10 m mast
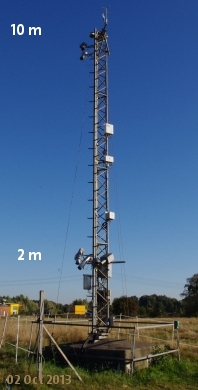
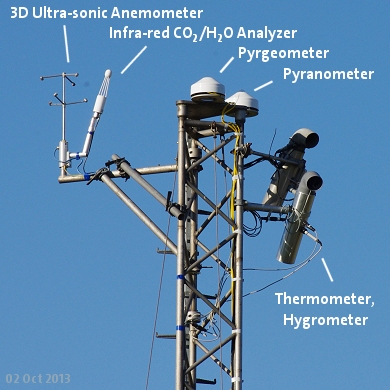
The 10 m mast on the meadow holds the following devices: The instrumentation in the level at 10 m equals those ones on the platforms of the tall 300 m mast (temperature, humidity, wind, turbulence). In the height of 2 m temperature and humidity is measured, too. There is mounted an infra-red thermometer that "watches" the ground for measuring the surface temperature. On top of the 10 m mast there are two irradiation sensors for downward short-wave and long-wave irradiation from the upper hemisphere (Kipp & Zonen Pyranometer CMP21 and Pyrgeometer CGR4) and, since 2014, a total sky camera for cloud observations (VIVOTEK FE8174V).
Measuring of turbulence
In 2000 the meteorological equipment on both masts was enhanced by five ultra-sonic anemometers/thermometers (USAT). They are mounted on top of the 10 m mast and on the platforms at 50, 110, 175, and 250 m. In the mid of 2010 we added a sixth USAT at the 280 m platform. These devices do not only measure wind speed and direction, but also the (virtual) temperature and the turbulent fluctuations of the three-dimensional wind vector. From these, amongst others the turbulent heat and momentum fluxes can be determined. Additionally, the fastest gust in each minute is determined out of the wind speed, that is measured with a 20 Hz sample rate. For that, we define the largest gust in a minute as the largest mean value over 3 seconds.
The ultra-sonic anemometers have replaced the prior used cup anemometers and wind vanes.
For measuring the latent heat flux, in addition to the sensible heat flux, fast infra-red CO2/H2O analyzers (Licor LI-7500) have been mounted directly at the 3d anemometers at 10 up to 250 m in 2013. These analyzers measure the concentration of water vapor and carbon dioxide simultaneously with the anemometer's wind vector.
Soil measurements
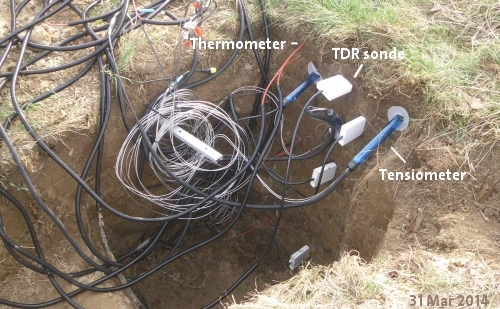
In co-operation with the Institute of Soil Science a ground station was established in mid of 2014 downto a depth of 1.2 m. The station is located on the meadow near the 10 m mast. In five depths we are measuring the soil temperature and the volumetric water content.
Additional instruments
A pressure sensor is located in the operator's hut (Vaisala PTB). Nearby there are devices for measuring clouds and precipitation.
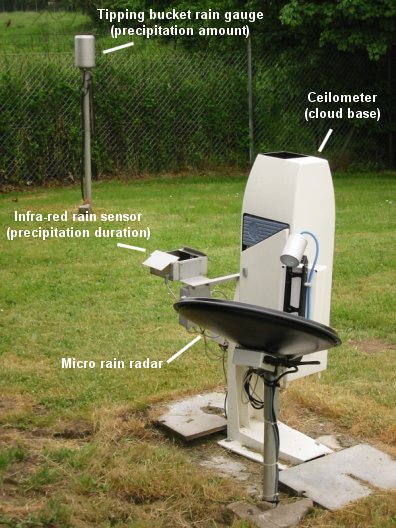
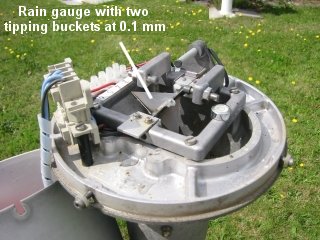
The tipping bucket rain gauge registers the amount of rain based on a resolution of 0.1 mm. The gauge can be heated in winter, so snow can also be measured.
The duration of precipitation can be registered exactly by an infra-red rain sensor (IRSS 88), a photoelectric relay counting the rain drops falling through an aperture of 12 cm × 3 cm. For each minute this device gives a 1 in case of rain and a 0 otherwise.
In the mid of 2008 we mounted a micro rain radar (METEK MRR-2). This device measures the rain rate, the fluid water content and the falling velocity of the rain drops in steps of 35 m up to 1000 m.
A ceilometer determines the height of the cloud base by measuring the run duration of an infra-red laser beam reflected by fluid water in the atmosphere up to 15000 m.
Data sampling and transmitting
All data is sampled by several computers inside the operator's hut. Most devices are queried once a second, but only averaged values are stored each minute. The ultra-sonic anemometers run on a sampling frequency of 20 Hz, the turbulent variables are calculated based on intervals of 1 and 5 minutes. The sampled data will be uploaded via DSL to our server in the Geomatikum every 15 minutes, where additional operations are made for creating the graphics on this website and storing the data in our archive.
The following tabular gives an overview over all height levels and measured variables. Alltogether there are about 50 independent measuring devices.
Variable/Device         Height (m)
--------------------------------------------------
Temperature             2 10 50 70 110 175 250 280
Relative humidity       2 10 50 70 110 175 250 280
Wind and turbulence       10 50    110 175 250 280
CO2/H2O concentration              110 175
Short-wave irradiation    10
Long-wave irradiation     10
Ultraviolet index       1
Atmospheric pressure    2
Rain amount (gauge)     2
Rain amount (Pluvio)    1
Rain duration           1
Surface temperature     0
Soil temperature       –0.05 –0.1 –0.4 –0.8 –1.2
Vol. water content     –0.05 –0.1      –0.8 –1.2
Ceilometer              30 to 15000
Micro rain radar        70 to 2100
Particulates            2
Weather camera (webcam) 50
Photos: Ingo Lange
